|
Sample Size Calculation using StudySize 3.0. Confidence
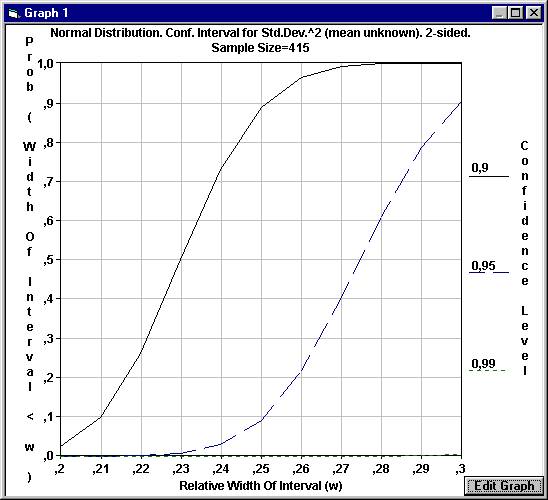
intervals for the variance In the development of a new device for measurements, one is interested to get an estimate of the precision. A study is planned where different but identical units are measured only once, since they are destroyed by the measurements. A study is planned to estimate the precision by calculating a 95% confidence interval for the variance (the squared standard deviation). It is deemed necessary to get a confidence interval for the true variance with a relative width of at most 0.3 in the measured units. The relative width is defined as the width of the confidence interval divided by the true value of the variance, or equivalently the absolute width in units of the true variance. The confidence interval for the variance is calculated by multiplying the squared standard deviation by the degrees of freedom (number of measured units - 1) divided by the 2.5% and 97.5% percentiles of the Chi-square distribution. Since the width of the confidence interval depends on the actual measurements, we can't be certain to get a relative width of at most 0.3. In the planning stage we therefore have to specify how certain we want to be to get the desired width. In other words, we have to specify the probability that we get a relative width that is at most 0.3. Assume that we want this probability to be 90%. Open
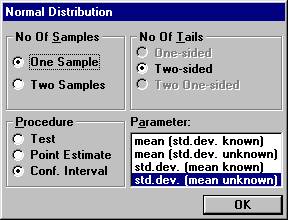
the File menu and choose New Calculation. Choose
among the parameters, std.dev. (mean unknown) and the option buttons
One Sample and Conf. Interval, and click OK.
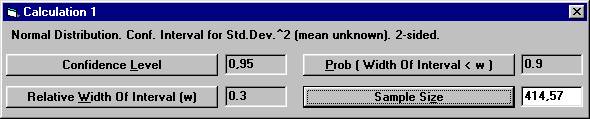
Set the parameter values as shown below, except for Sample
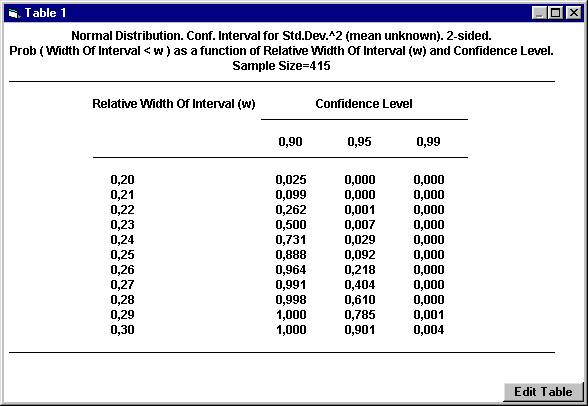
Size. If we decide to perform a study with 415 units, we might want to know the probability that we instead get a confidence interval with an even better precision. We want to see how the probability of the relative width of the confidence interval varies for different values of the relative width. Open
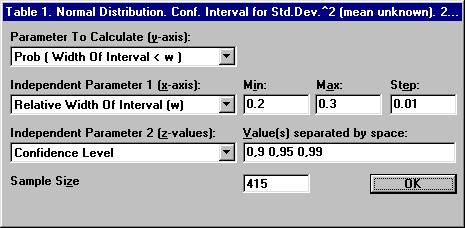
the File menu and choose New Table. The
previous options for the normal distribution will show up. Set
the parameter values as shown below and click OK
To
see the relation graphically, open the File menu and choose New Graph.
|