|
Power analysis using StudySize3.0 in a multiple comparison
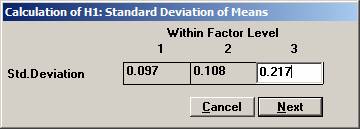
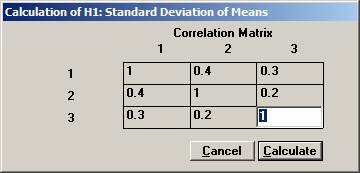
procedure of the means from a multivariate normal distribution. In a clinical outcome trial one of the objectives was to test if the addition of a new drug on top of standard treatment would benefit patients with acute coronary syndrom (ACS). The plan was to study the time to a non-fatal myocardial infarction, to a non-fatal stroke, and to a re-vascularisation. Each time would be recorded and analysed separately with a log-rank test. Since the occurrence of these events would depend on each other, the separate log-rank tests have to be treated as dependant tests. The log-rank test can be approximated for large sample sizes with a test based on the logarithm of the estimated hazard ratio, i.e. log (estimated HR) is normally distributed with a mean log(HR) and a variance 1 / Es + 1 / En, where Es and En are the expected number of events in the standard and new drug group, respectively. Hence it could be assumed that that the three estimated log(HR)’s followed a multivariate normal distribution with a correlation matrix as described above. The three null-hypotheses to be tested were H0: HR = 1 for each of non-fatal MI, non-fatal stroke, and re-vascularisation. It was considered important to detect a 20% lower risk for each of the three hypotheses, H1: HR = 0.8, and to control the family-wise error rate at 5%. From previous trials it was found that the correlation coefficient between the estimated log(HR) for non-fatal myocardial infarction and non-fatal stroke could be assumed to be approximately 0.4. Similarly, the corresponding correlation coefficient between non-fatal myocardial infarction and re-vascularisation and between non-fatal stroke and re-vascularisation was 0.3 and 0.2, respectively The size of the trial had been calculated for the primary variable, the composite variable time to first event of non-fatal MI, non-fatal stroke, or re-vascularisation. With 90% power it turned out that 860 events were needed. It was assumed that the proportion of events should approximately be distributed as 50%, 40%, and 10%. The expected number of the three event types would then be approximately 430, 344, and 86. Under H1: HR =0.8, these should in turn be distributed as (239, 191), (191, 153), and (48, 38), respectively, for (new drug, standard). Using the formulas above for the variance, the three standard deviations could be calculated to 0.097, 0.108, and 0.217. To calculate the chance to detect at least one of the risk reductions Open
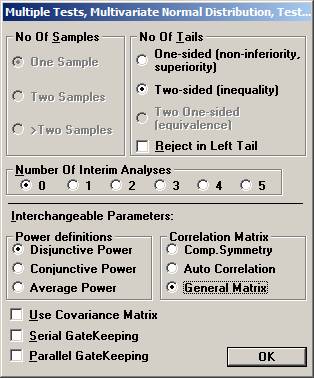
the File menu and choose New Monte Carlo Simulation. Set options Two-sided, no interim analysis, Disjunctive Power, and General Covariance Matrix and click OK.
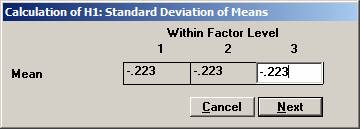
Set
the means to -0.223, -0.223, and -0.223, i.e the logarithm of 0.80
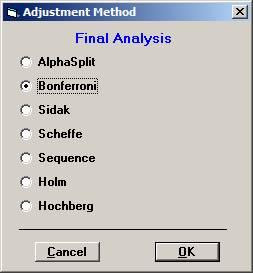
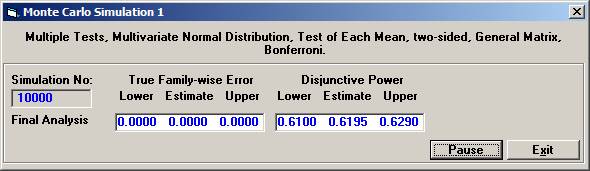
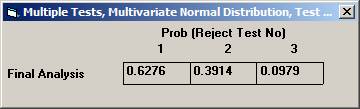
Choose Bonferroni as the adjustment method. After 10000 simulations the Disjunctive Power is estimated to 0.6195. The probability to a get significance in the individual tests are 0.4604, 0.3683, and 0.0863, respectively. If instead one chooses to test in sequence, starting with the non-fatal MI, then non-fatal stroke, and finally re-vascularisation, i.e. in the order of expected number of events, the disjunctive power will be marginally higher but the individual significance probabilities somewhat higher, 0.6276, 0.3914, and 0.0979 (conditionally that the pre-ceding test is significant). |