|
Power Analysis using StudySize 3.0. Bioequivalence trial
with interim analysis A new formulation of a drug has been developed. A two-way crossover
study is planned to compare this new formulation with the existing formulation.
The concentration of the active substance is measured over a 24-hour
time interval and the area under the concentration curve (AUC) is calculated.
The new formulation is considered bioequivalent to the old one if the
ratio of the true mean AUC can be concluded to be within the interval
0.80 to 1.25. The null-hypothesis is that the true ratio is outside
the interval. Bioequivalence is concluded if the null-hypothesis is
rejected. The null-hypothesis is rejected at an upper significance level
of 0.05 if the two one-sided tests for testing the ratio is less than
0.8 and greater than 1.25, respectively, both are rejected at the significance
level 0.05 (two one-sided test situation). It can be shown that this
is equivalent to a confidence interval for the true ratio, with confidence
level 0.90 is entirely within the interval 0.8 to 1.25. The analysis for the two-way crossover design is performed
using an ANOVA on the log-transformed AUC values. The study is planned
to have a power of 0.80 to conclude bioequivalence if the true ratio
is approximately 1.05 at the significance level 0.05. The expected residual
standard deviation in the ANOVA (the within subject standard deviation)
for the log-transformed AUC values is assumed to be in the range 0.15
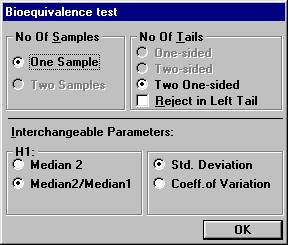
to 0.25. Open the File menu and choose New Table. Set the following options and click OK.
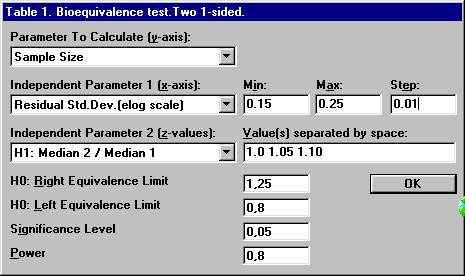
Set the following values and click OK.
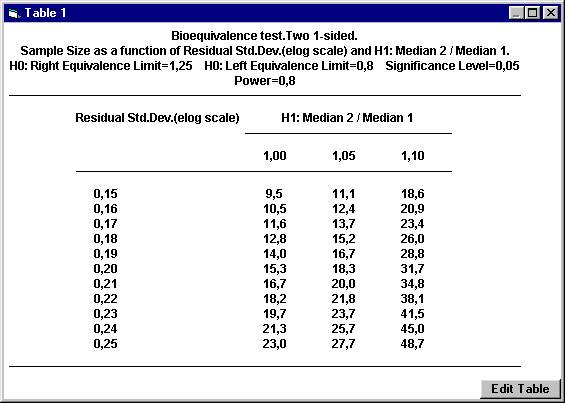
Since the study is planned to be a 2-period crossover study
and we usually want the same number of patients in the two possible
formulation sequences, the sample sizes should be rounded upwards to
the nearest even integer. For example, with a ratio of 1.05 and a residual
standard deviation of 0.20, the sample size 18.3 should be rounded upwards
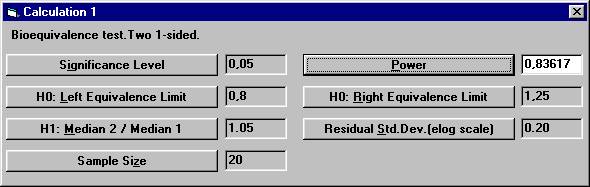
to 20. To calculate the power for 20 subject, The dialogbox with the retained values will show up. Click the OK button. Set the following values except for power and then
click the Power button. There
is now a suggestion to investigate if bioequivalence can be concluded
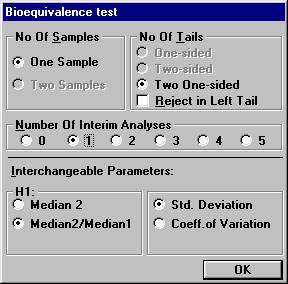
before all 20 subjects have entered the study. Open the File Menu and choose New Monte Carlo Simulation.Open the Test Procedure menu and choose Bioequivalence test. Set the number of interim analyses to 1 in
the dialogbox. The old parameter settings are retained.
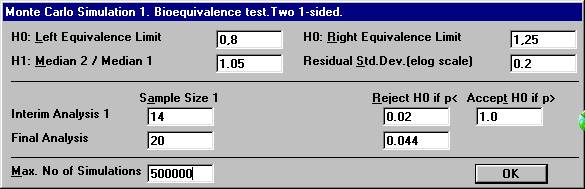
A new dialog box will be shown. To compensate for two analyses, one has to choose the significance
level at the interim analysis and the final analysis in such a way that
the over-all significance level will be 0.05. There are many possibilities
for such a design. Set e.g. the values as shown below and click OK.
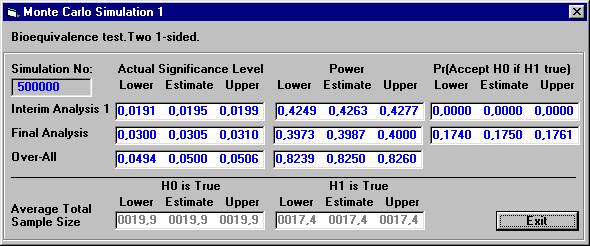
The
results are presented below after 500.000 Monte Carlo simulations
|